Increase Your Testing Velocity and Serve the HiPPO 20 Ideas with a Side of Data
Click the video above to watch my Award Winning Experiment Nation presentation and find out how to Increase your testing velocity. In the video, share a framework for businesses to enhance their marketing results through data-driven testing and predictive insights. Drawing from my experience at Microsoft and my own agency, I introduces the concepts of click-testing and stacking small, incremental wins to drive significant growth over time. Through detailed examples and case studies, I illustrate how focusing on continuous testing—particularly with predictive metrics like click-through rates and heatmaps—can transform GTM ROI.
One standout example shows how a headline switch on a landing page boosted engagement by 600%, and how one company using this methodology went from $0 to $500K in year one and scaled to $4M in year two. I provide a step-by-step guide for rapid click-testing of multiple headline variations, allowing marketers to quickly determine what resonates most with their audience.
0:04 Introduction & Experimentation Background at Microsoft
3:51 Stacking Small Wins
10:07 Using Predictive Testing
15:25 Heatmap Data with Optimized Content
19:13 Enhancing Engagement with Optimized Content
22:09 Testing Multiple Headlines to Maximize Impact
24:23 Using Click Testing
30:15 Case Studies & Success
P.S. It feels amazing to be recognized by the Experimentation community!
Transcript
I'm Jessica Jobes, CEO of Vital Velociti, Experiment Nation, good to see you. We are talking today about - increase your testing velocity and serve the hippo 20 ideas with a side of data. So who am I? Like I said, I'm Jessica Jobes. I was at Microsoft for 13 years and eight of them were on Bill Gates favorite engineering team of all time.
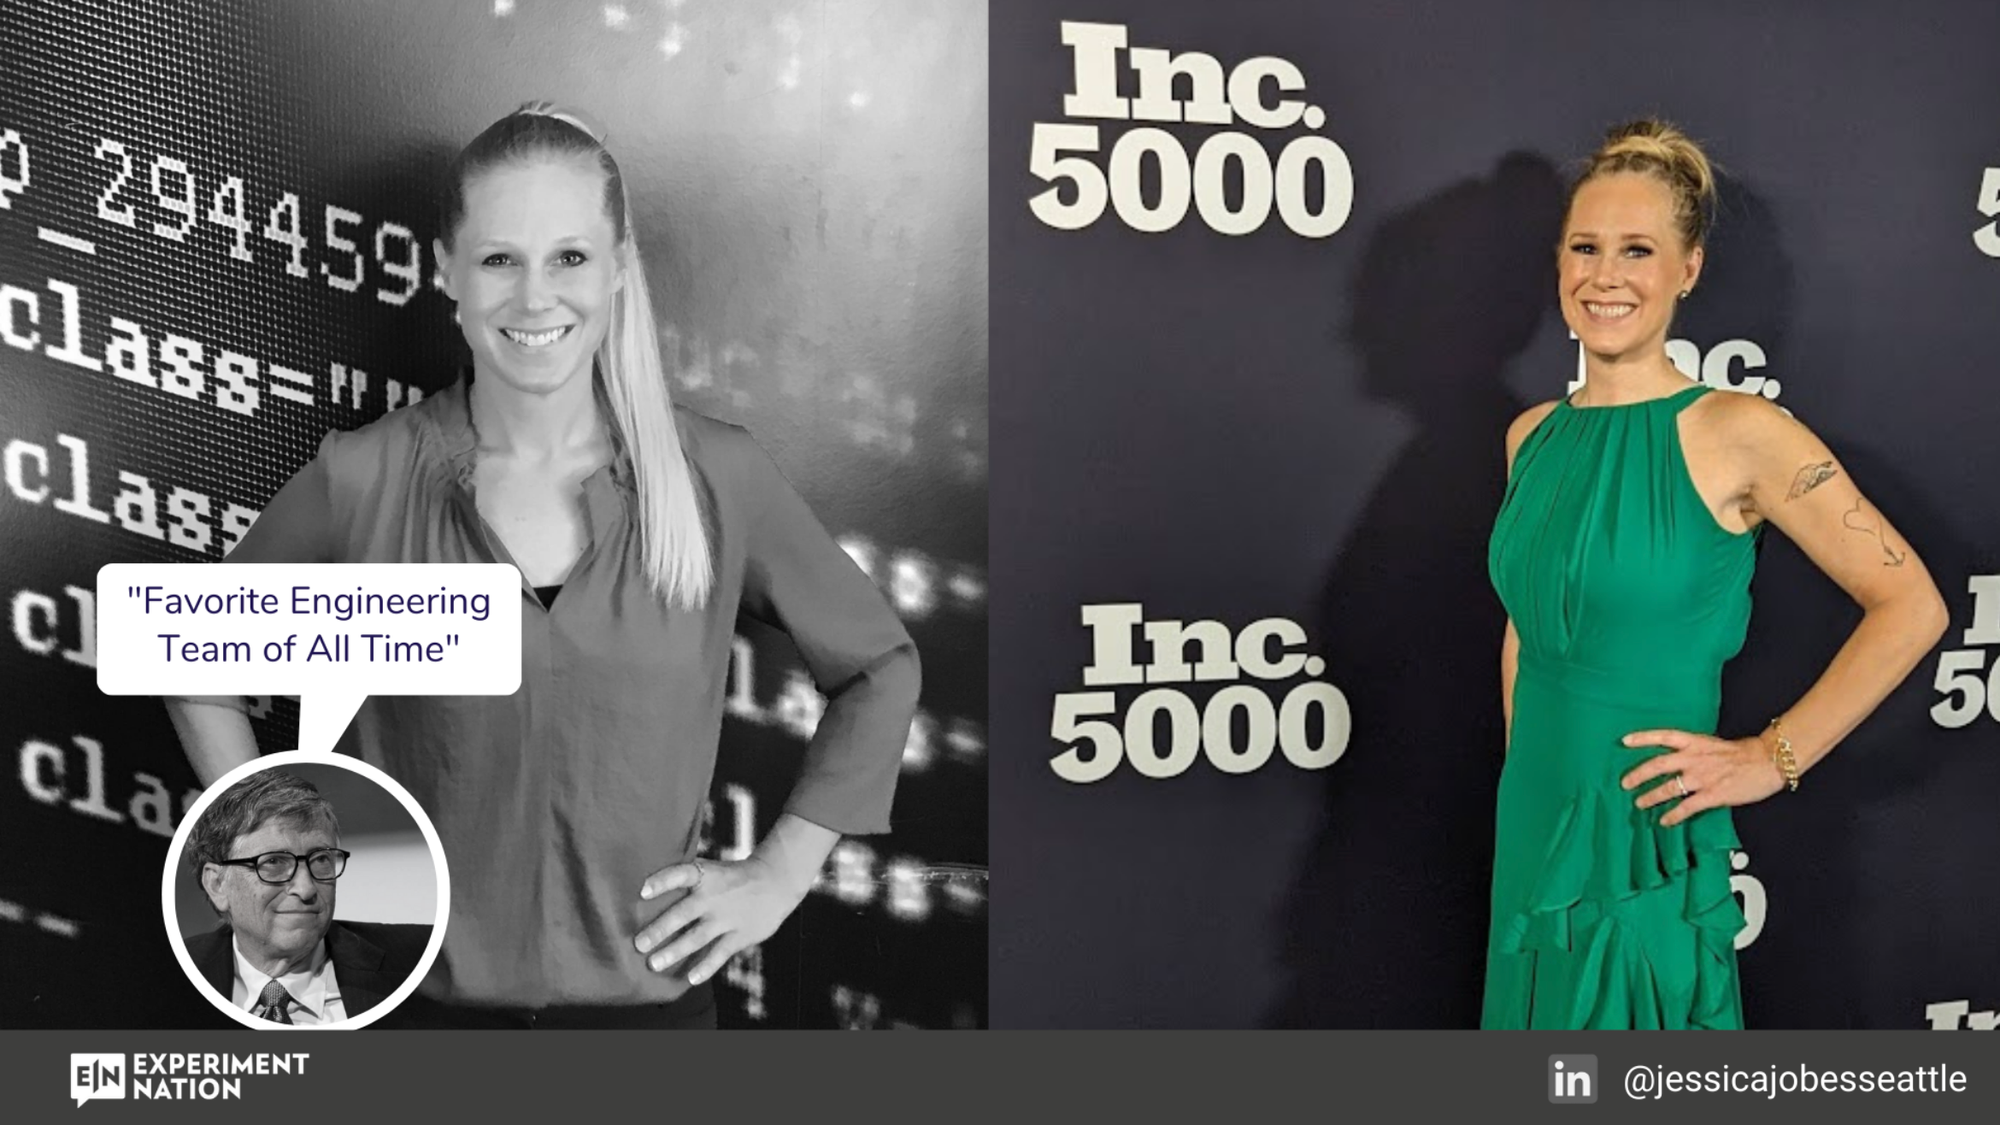
I've also made the Inc. 5000 list by starting and growing my own company. And I'm going to show you a key piece of the methodology I used in order to grow my business. Let me go back to Microsoft.
We were a growth machine on this engineering team. We did 49 consecutive months of growth.
Grow, grow, grow, grow, grow. That's the DNA that was formed in me that's what I knew how to do. That's how you grow a business, right? You just do these things and your business grows, do these things and it grows.
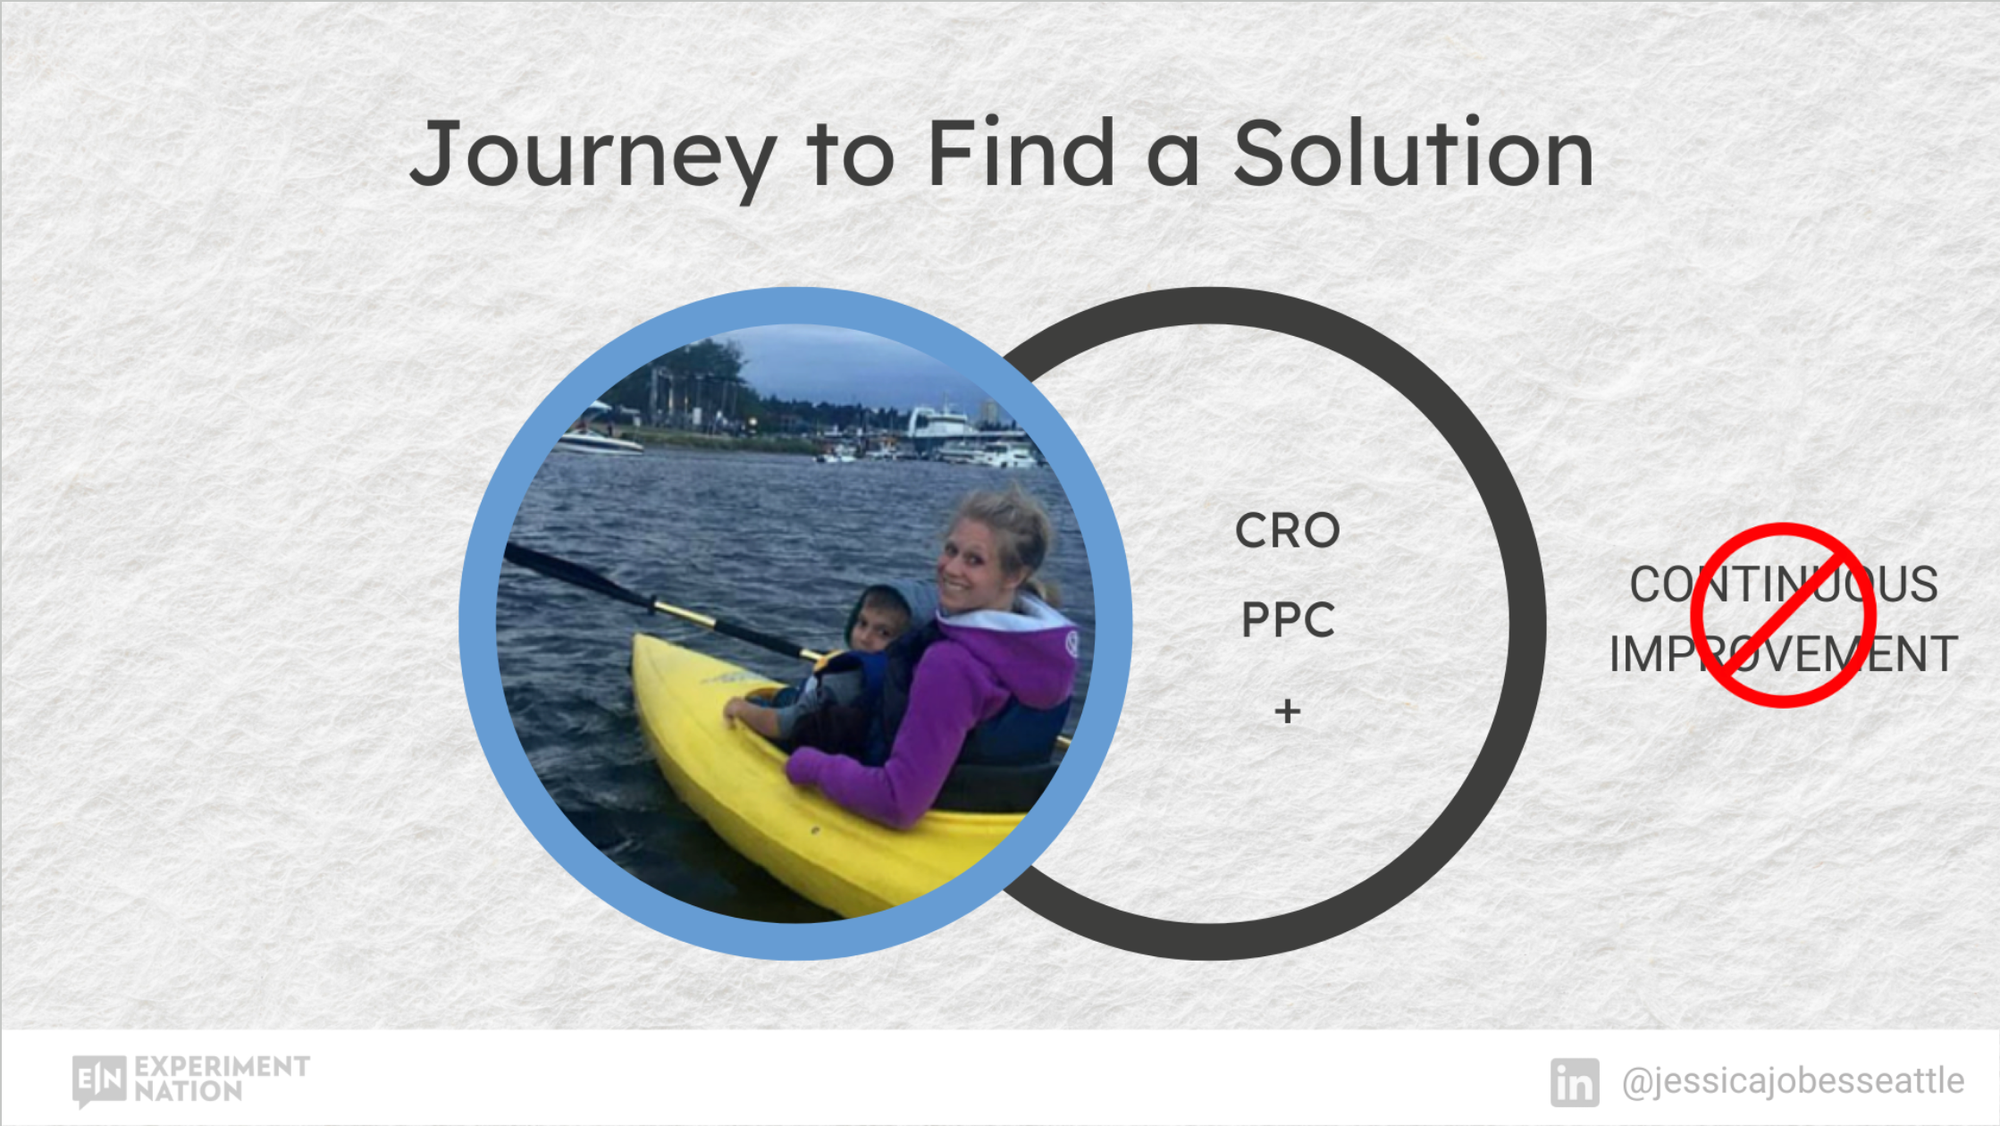
Right? Wrong. That's not reality. When I left Microsoft and I was out on my own growing my own business and I started a marketing agency, I was growing other businesses. We could do all the things, all the best practices, CRO, PPC, SEO, we could drive traffic, we could get conversions, but I couldn't get to that continuous improvement.
And so I knew something was missing. And what I did is I told my team, stop everything. We stopped offering services. I even told them to delete blog posts, just delete everything. Stop, because I really needed us to focus. What is it that's actually going to work? And in the end I ended up going off on a solo journey to figure out this solution.
I couldn't replicate what we were doing at Microsoft because there was 3000 engineers running 230, 000 experiments a month. Obviously those numbers are boosted by machine learning and AI. But what were we doing there that I need to be able to replicate outside of Microsoft?
This is the best way that I could explain it. We were a huge team, and we focused. We focused on our five main business assets. So let's say one of those is a home page. You focus on that home page and you're running experiments - doing CRO (Conversion Rate Optimization).
We're trying to make that home page better and better and better. But instead of running every single test to statistical significance and getting a ton of data and getting that certainty on - are we moving in the right direction or not, because our sales are going up, yes or no - we're using prediction metrics.
So we're launching an experiment and we're just looking at a metric that's tied to revenue. We're looking at that metric and we're seeing, does the needle move when we launch this new idea? Is it moving in the right direction? And if it is, that gives us the confidence to increase traffic to that test or to go ahead and launch it to live site.
So we just did this over and over and over. And what we're doing when we're using predictive metrics to move in the right direction, we don't need a big movement. Obviously we're going to get some big wins through this process, but we're looking for little wins too, because those little wins are going to stack up over time as well, especially when you've got your testing velocity up.
A lot of times that means you've got your idea velocity up - when you can test a lot of different ideas, then you don't care as much about every single idea, you're just looking for, okay, what are the ones that are going to move that needle up 2%, 2%, 2%, 2% and you're just stacking these little 2% wins over time.
Okay, so that's what I set off to discover, was the ability to run prediction experiments so that I could get some signal, like fast feedback and get enough of this signal that can help me with the rest of my growth marketing.
So the easiest way for me to explain this is to take one variable and let's run it through.
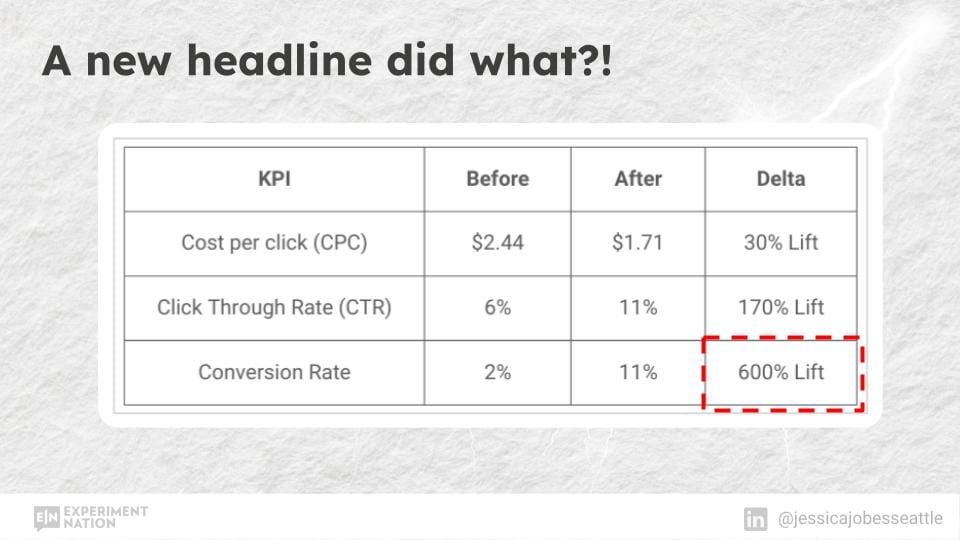
Let's take headlines as that variable because headlines by themselves can have a huge impact. Here's one of our case studies where this is Google Ads where we just switched out the headline. And improved the cost per click, improved the click through rate on the ad, and we had the same headline that's in the ad on the landing page, and it got to 600 percent uplift. You guys have probably seen this before as well, where you can get a huge lift from a headline.
Well, how do people come up with the perfect headline?
Everybody sits around a room or sits on zoom. It could be five people, 10 people, 20 people. It could be two people. Could be one person. You don't know. (Probably not one person. That's a different scenario.) All right. So it's a group of people. You come up with 20 different ideas. Maybe it's prescriptive based on, we want some headline ideas that are about saving time, saving money, coming up with a USP or retention, right?
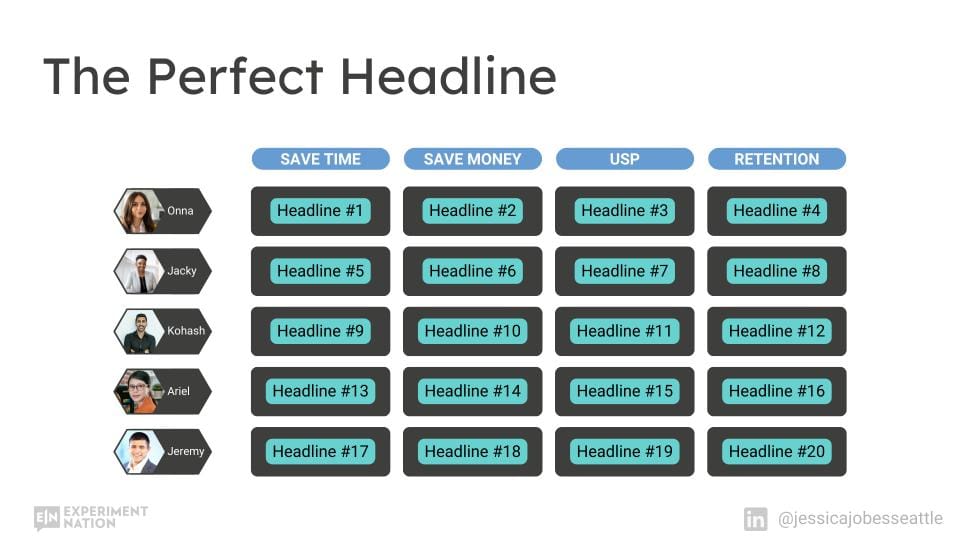
So you get your 20 different ideas. And then people start to knock them off, saying, "I don't like this" or "I have a concern". I keep hearing, I have a concern, I have a concern, over and over and over and essentially it's just saying, no, I don't like that idea, I don't think that's going to work. And then there's also some maybes that come out of that, but you whittle it down to a few that don't have as many no's, and those end up getting put in front of the HiPPO, who is generally going to say, this is the perfect headline, end of story. Somebody is going to make that decision.
Somebody is going to stick their neck out and you end up getting a "winner". So let's say in this scenario, Kohosh has the winning headline, which is headline number 10.
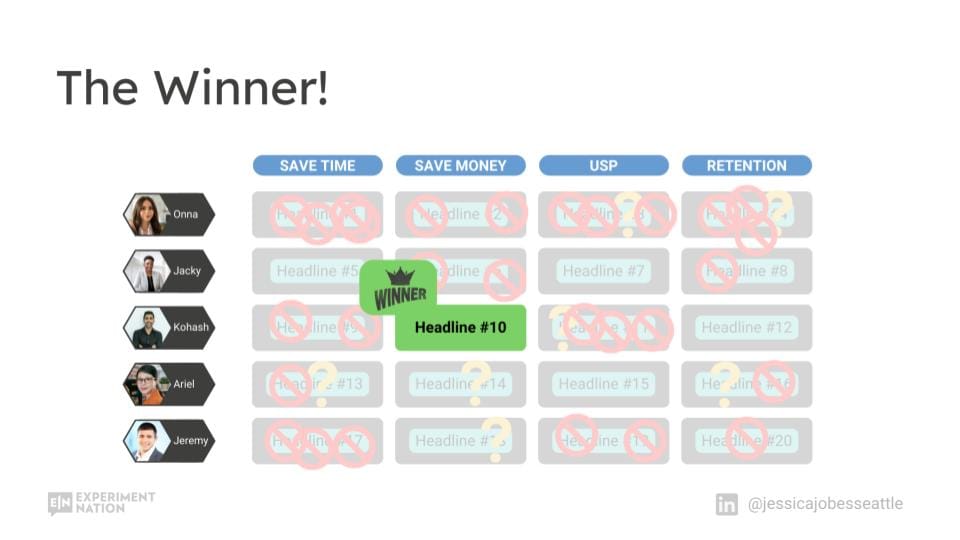
This can be a very emotionally taxing process for people, especially folks that don't like to argue. It can feel quite personal because creativity is very personal, it can be quite expensive going through this process and people just weigh the risk versus reward. How much do you want to argue for something or really push on something when there's maybe not that much reward and you don't know if it's going to work or not.
So take somebody like Ana, who you know, she's got her ideas and received lots and lots of no's. So that probably wasn't a very positive experience for her.
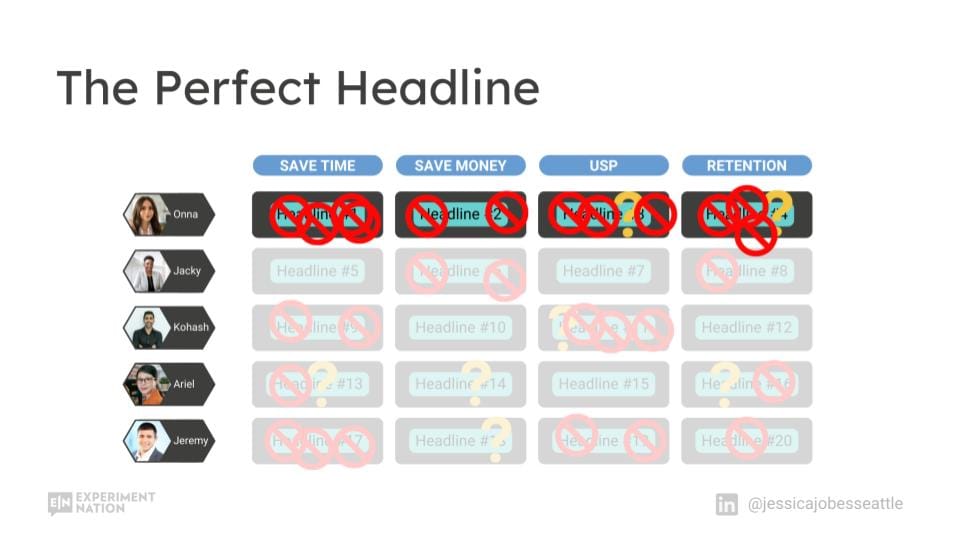
Whereas for Kohosh maybe it was a more positive experience because a couple of his ideas made it through and maybe he pushed harder than Ana did.
Now, if you're the PMM running this and you're trying to herd cats over and over and over, because we were just talking about a headline. Think of how many variables are on a webpage or a website and you've got to do this so many times. It can be quite exhausting, right? But eventually you get there, eventually you've launched the homepage and it's as perfect as you can get it in order to get it to this place.
Typically, that's the first time you're getting data to see whether it's working or not. So what happens is, now that you've got your home page, you're getting data in.
If you're not getting the results that you expected from it, this is usually how you feel, like I'm kind of stuck with it, because I don't really want to go back through that process again. So you end up in a situation ship.
So, what if you wanted to test 20 headlines, where all ideas are good ideas? You could test them up on your live site, or run CRO, and you're just switching out one variable. Typically, that's pretty expensive, even though you're just switching out one variable, which is copy. You're using very expensive traffic for this.
You could be running other experiments that can move the needle more. And likely to run through that many headlines. It's going to take you some months to do that. Through this process, though, you will get a winner or maybe a couple different winners.
What's another way you could go to Wynter, which is B2B software, where you can test three different headlines in 48 hours with a panel of your ICP, which is extremely powerful.
Now actually let me switch gears for a sec. Let's talk about this. Itamar Gilad,
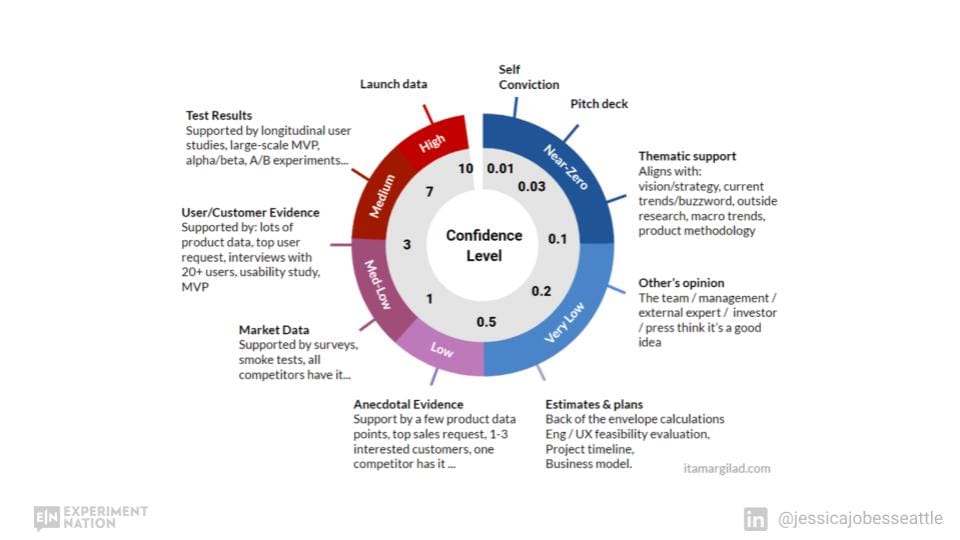
which I'm guessing you guys are familiar with. But essentially, how, how big of a weight should you put into your ideas? This model gives you different confidence level scores based on where those ideas are coming from and whether you have data or not, and what level of quality is that data?
So self conviction is at the 0. 01 level all the way up to 10, when you actually launch it and get real data from your ICP on your live site. So quite a range there. This is how I like to simplify it for what I do, which is using same confidence level scores from zero to 10.
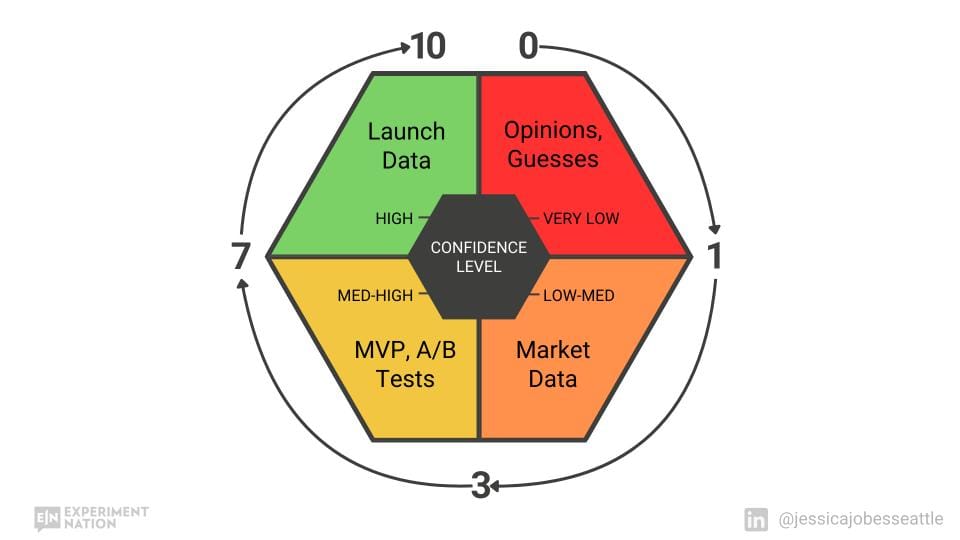
Starting over here, your opinions and guesses are very low, zero to one. Collecting market data that's low to medium - it's in the one to three range, doing AB tests and an MVP gets you higher. And then launching gets you all the way up to 10. So where does Wynter fall on this? Wynter is in this range - panel testing is in market data: low to medium, one to three.
But what's cool about this is you can get those results back really fast. So you can get some signal back from your audience. It could be quant or qual data, which is great - and what we're talking about is 20 headlines, right?
How do you test 20 headlines? So you could run seven different studies up on Wynter where you're testing three headlines in each one, and that would take you longer than 48 hours. Let's say it takes you a month. I think the biggest detractor from this is the cost, because it's another test, another test, another test, another test.
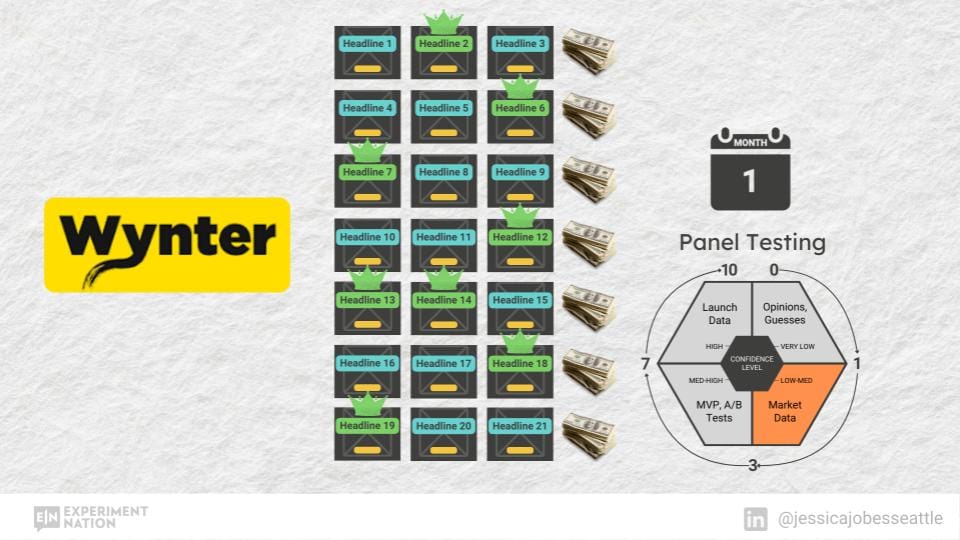
Through this process though you'd get signal from your ICP, and it would help you decide what to do next.
There is another way. How can you increase your testing velocity using prediction metrics and running prediction experiments? That's what I'm going to show you here. And it's called Click-Testing.
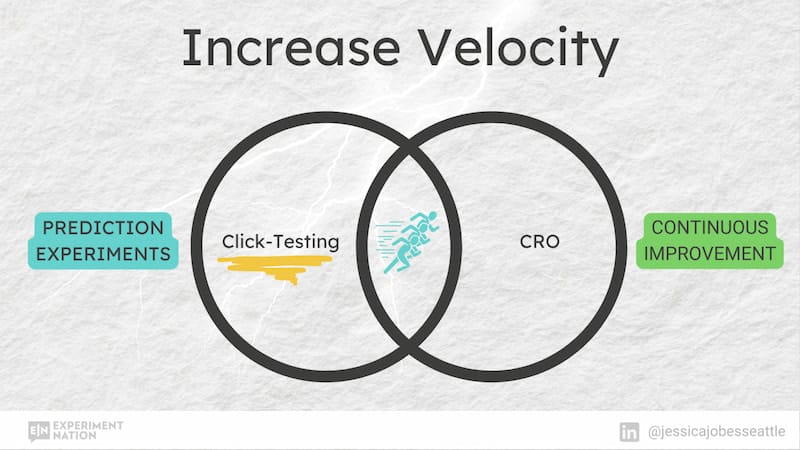
So this isn't the click-testing that you're probably thinking. If you go to Qualtrics or some other panel research software, you can put up different images in front of a panel of people and say, would you click on this or this, how about this? So you can get the conscious level click data on what they click or not.
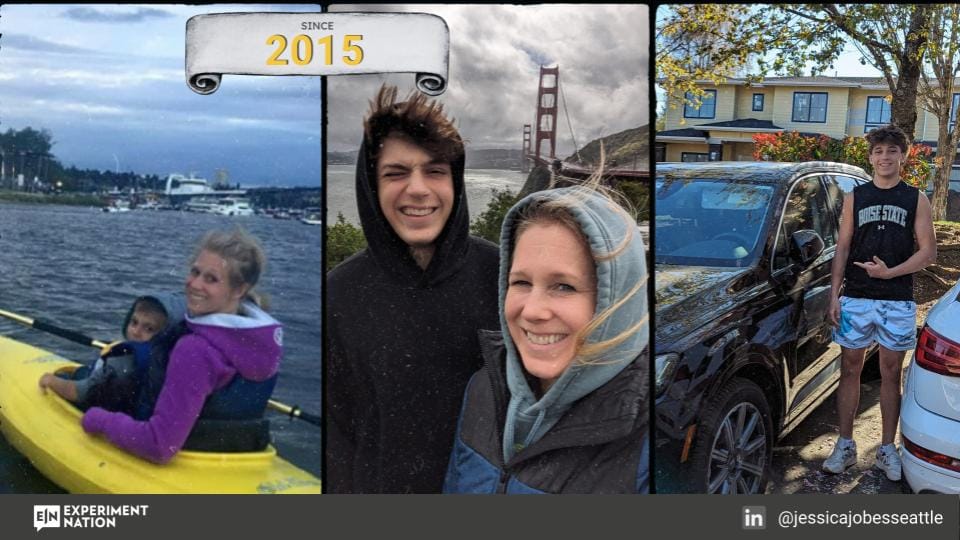
I'm talking about subconscious click data. We're talking about people that don't know they're in a research study and they're either clicking or they're not clicking. I've been doing this since 2015. This is how long that's been. My son was about this age when I started. Here he is. He's obviously grown up and he's driving now.
So this methodology has been battle tested. I've had over 800 clients and generated 175 million plus in revenue using it. So do you guys want to see what this looks like? All right. So with click testing, we're going to be testing all 20 headlines in 48 hours.
We're still in this range where it's market data. But it's not very expensive. It's really fast feedback from your audience. And through that, you get signal on which of those 20 headlines is likely resonating more with your audience. This is what the data looks like... This is a test I ran with Mouseflow recently where we're testing 20 different headlines for their heat map software.
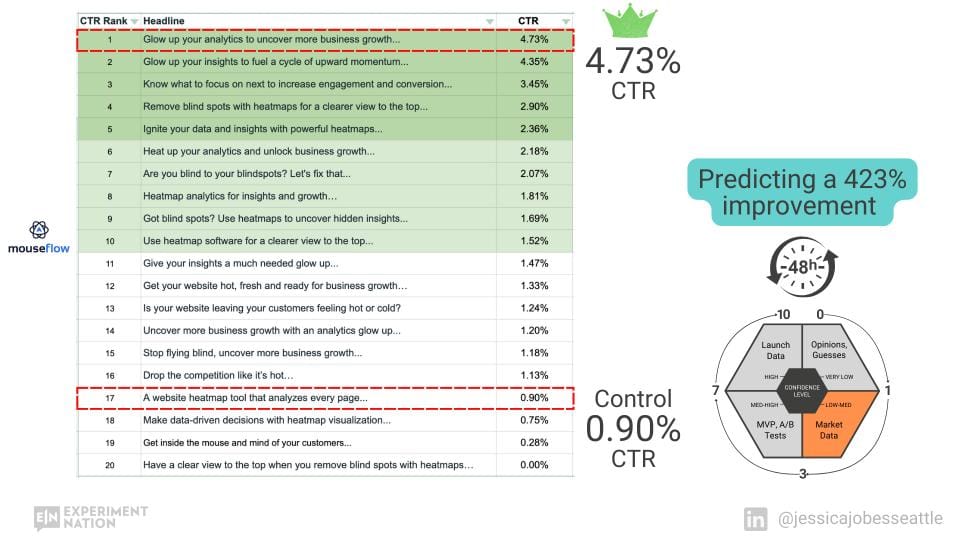
And the prediction metric we're using is click through rate (CTR). What gets the audience clicking more? And in this test, it ranged anywhere from 0 percent to 4.73%. So at 0%, "Have a clear view to the top when you remove blind spots with heat maps" versus the winner, "Glow up your analytics to uncover more business growth."
And then the control is right here, "A website heat map tool that analyzes every page that got 0.9%." So if you're looking for a prediction test, which of these headlines is likely to beat control, you can see the spread here is quite a big spread, right? From 0.9% percent to 4.73% is over 400 percent improvement.
That's the prediction. And so this is a pretty strong signal. If you take this back to the HiPPO or to your manager or whoever, where you're like, okay, we just came up with those 20 ideas two days ago. Look at this data. This is going to help us make the decision on which one to move forward with. So what we're talking about here is data-informed decision making, not data-driven.
Just because this headline tested the best, doesn't mean that that has to go into the next step and run an A/B test. You can make a decision on whether the team still likes this idea or not, and whether you want to take it forward or not. But having this data to go alongside it can make that decision a lot easier.
All right, so how do we get this data? Okay, I'm going to let you in on a secret, but it's just between us...
I leverage Facebook ads for market research. All right. So I'm already seeing people drop off. Yeah, yeah, yeah. Facebook ads.
Don't think about Facebook ads as, as Facebook ads. Think about it as a market research tool. So there's millions and millions and millions of people up there.
That's your panel. You've got access to them as a panel and you're going to put ideas in front of them in the form of ads. You're going to serve up some ads and you're just going to see, are they clicking on this or this? Do they click on this? How about this? Okay.
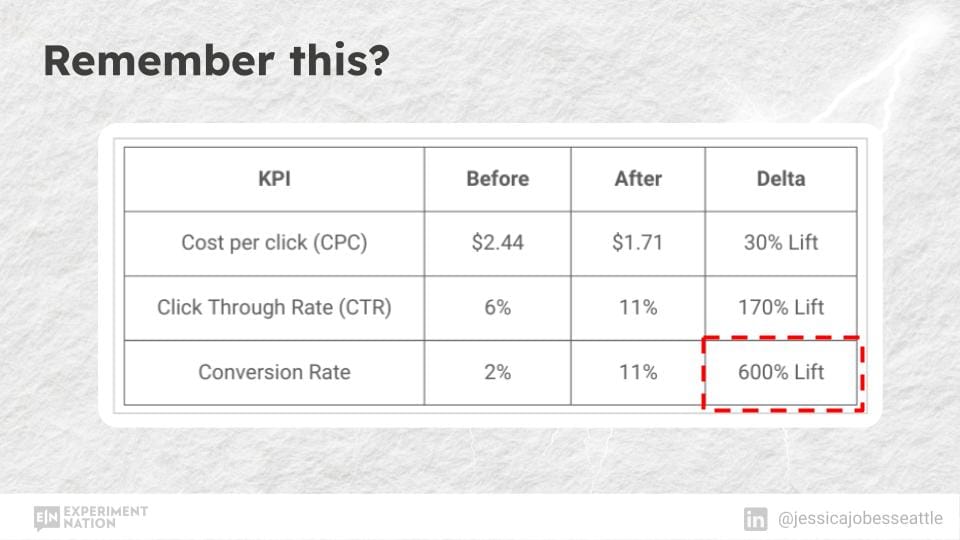
So this is how I got to the 600 percent lift in this campaign, which I click-tested different headlines, found the headline that tested the best - used that in our Google ad, and used it on the landing page. So it can be quite powerful to go from a click-test into another campaign on another platform, on your website, that sort of thing.
Here's a quote from Russell, who is one of my clients. He's now an exited founder. He's got a Harvard MBA. He used click-testing to grow and sell his company. And he says, "Take control of your pipeline by letting go of what you think you know, the most important thing is testing and letting the market inform you and that gives you control over your pipeline."
So click-testing, it measures your ICPs subconscious actions. Gerald Zaltman, he's a professor from Harvard business school. He's discovered that 95 percent of purchasing decisions are made at the subconscious level. So that's why this click-testing can be quite powerful because it is subconscious data.
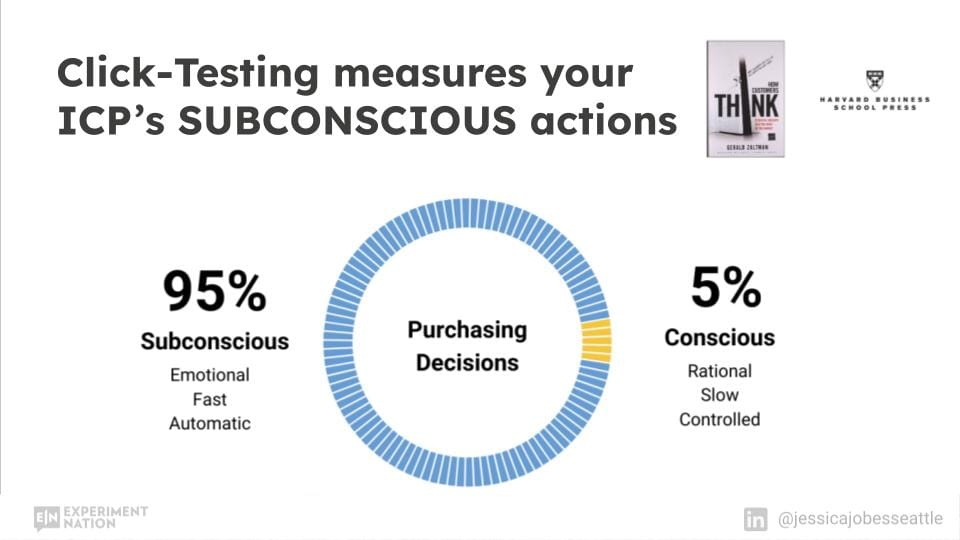
And a lot of times what gets your audience clicking is the same stuff that gets them converting and pulling out their wallet and purchasing or getting on a phone and doing a demo with you.
All right. So here's another example of what we do with click tested headlines where we're looking at a landing page. So don't just think of a headline at the top of your page. There are other headlines on your page. And a lot of times in my designing we'll make the headlines larger because if we get that click-tested headline, right, it's going to pull the eye and it's going to keep engaging your audience further down the page.
So in this case, this page had 17% conversion rate. This one had 21%. And all we did was switch out the headlines. So we did click-testing to switch that out. And let me show you behind the scenes why we chose to isolate this variable and test it - is because we're looking at heatmap data with Mouseflow and we're looking for patterns.
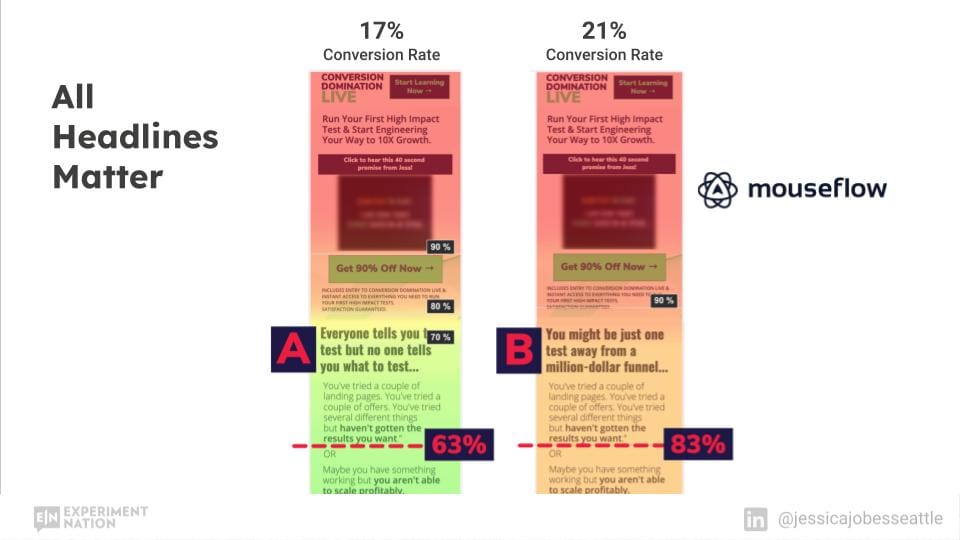
So we're doing some pattern recognition. And again, we're looking for prediction metrics, prediction experiments, that sort of thing. In this case, what we're looking at here is this pattern, which is when you see these little friction blocks close together. These percent users have made it done to this far.
When you see those little blocks close together, that means that there's a lot of friction there and people are leaving. And so we noticed this pattern. We know that headlines make a big impact. So we click tested different headlines, switched out this headline for this one, which tested better. And you can see people stayed longer.
And so if you get more people, more eyeballs going down to the bottom of your page and your page converts, that's when your conversion rates are going to go up. Here's another example where we use click-testing on a client where this is another professional CRO agency. You can see they just weren't moving the needle.
And then we came in, this is a example where we trained that agency. We taught them some pattern recognition and how to do some click-testing. And the first test they got a huge bump. So you can see how powerful it can be.
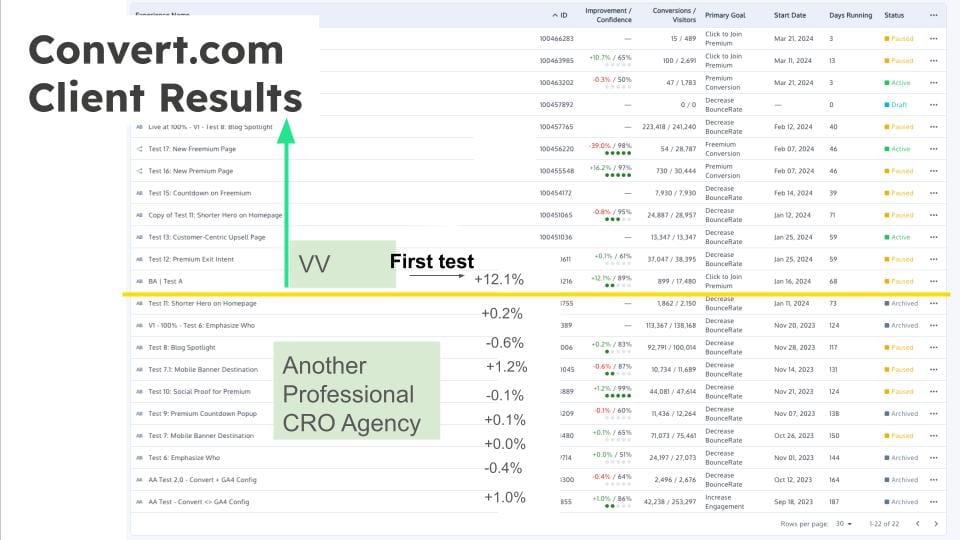
Now, you're not always going to get a bump like this. But when you zero in and you're testing the right things, and when you're doing your click-testing, you're seeing some spreads like that, that's when you're like, "Ah, I got them. I know what my audience wants."
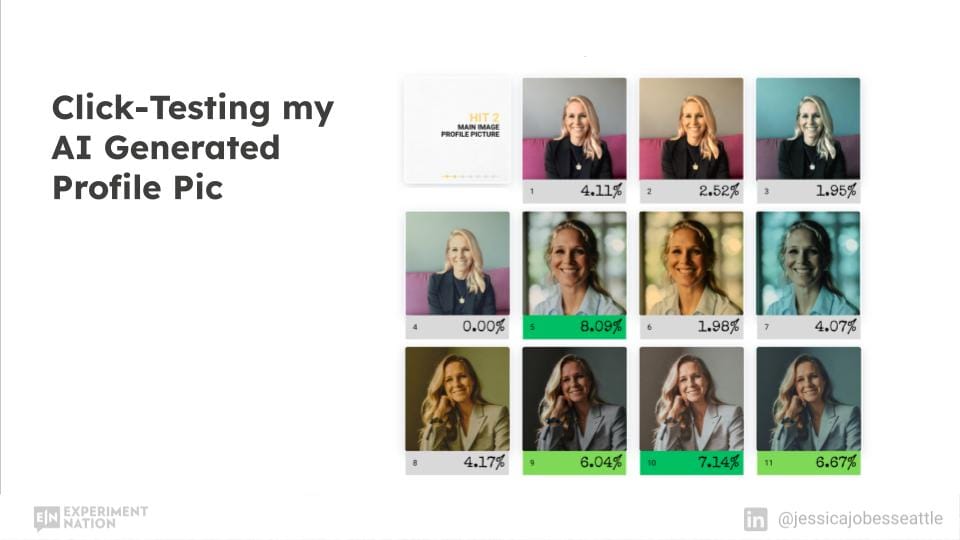
Here's an example of me click-testing my AI generated profile picture. So I launched this agency in April. And over the last, I don't know, eight years, I've driven all my business from Facebook ads, to, I spent millions of dollars on that for this agency, I wanted to work with larger companies and decided to switch over to LinkedIn to do more marketing on there.
And what are some of the assets that I need to test for my LinkedIn profile? Well, number one, my profile picture, right? So you can think about this. If you have a brand. If you have any sort of company where you have some images that you need to test, you can click test those images. So I'm just showing you for my personal brand, what I did, where I needed to come up with some professional headshots, which I didn't have.
So I did some AI generated ones. And I thought this one would win. So I was sure of it because color block tends to do really well in click-testing. But it didn't win. This is the one that won, it got 8% click through rate. However, I felt like this one was a better represent representation of who I wanted to be at this new agency, professional, wearing a suit, that sort of thing.
So I ended up going with the second place image, which was 7. 14%. And you can see this pose overall did better. This one only had one winner. This one had no winners. And so so I felt pretty confident going with this pose and with this filter. So if you look at my LinkedIn profile, if you look at my webpage, you'll see this image on there.
Alright, so I also click-tested illustrations, so you can do this as well. In this test, I think I had about 40 different illustrations that I was testing. So this is just some examples of the ones that tested well and didn't test well. You can see the variety that I test. So this one got almost 5% click through rate.
"I feel like I'm paying my digital agency for work, not results, with a little guy putting money down the toilet." This one got second place. And you can see this is a company. It's depicting a company that's already grown and scaled and then having challenges with the changing digital landscape, and then we help them break out and reascend.
I like this illustration a lot better than something like this for the top of my homepage. So you can see here where I took this image. And that became the top of my homepage up here. And you can see that in my different marketing material, you'll see me use that illustration.
Let me go back. So the other thing I did is I took this one here, which it has a pretty good way of summarizing what my agency does - I pulled that forward and I did a headline test. So this variable has already tested well with my audience. So now I just want to add on another variable, but I want to keep this the same, so lock that one in and then add, so I'm basically stacking on another variable. And let's see how that headline does. The image is also providing more context.
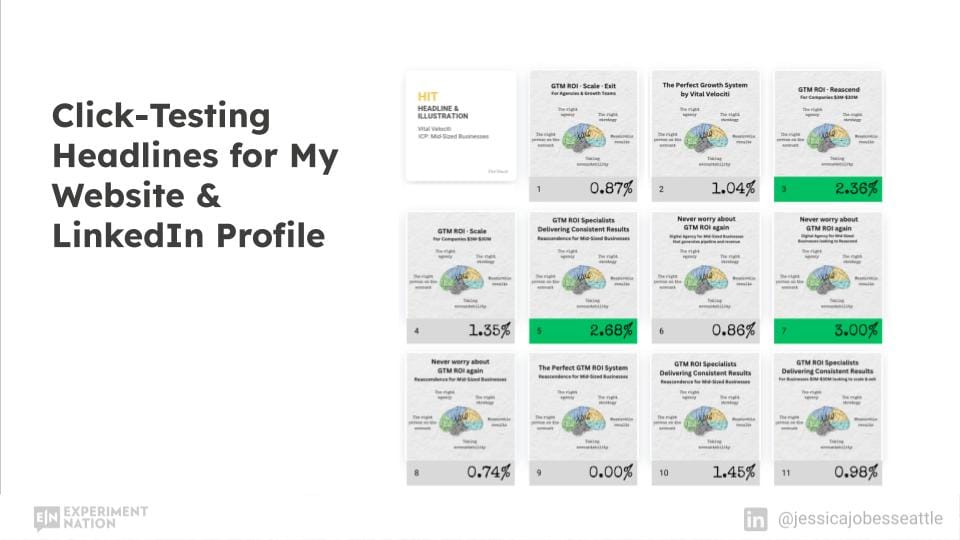
So it's not just a headline. It's a headline plus image. And you can see that this one won, "Never worry about GTM ROI again". This one got second "GTM ROI specialists, delivering consistent results." And I decided to go with the 2nd place one because it felt more authentic to what we do. So the way I think about this, especially with doing click testing for a company of my size, where I'm not driving a ton of traffic into my website. This is an asset. I have some heatmap data on there so I can see what's going on. But essentially I just needed to know what does my audience want? I needed some signal to be able to make fast decisions. So I went straight from market data to launch.
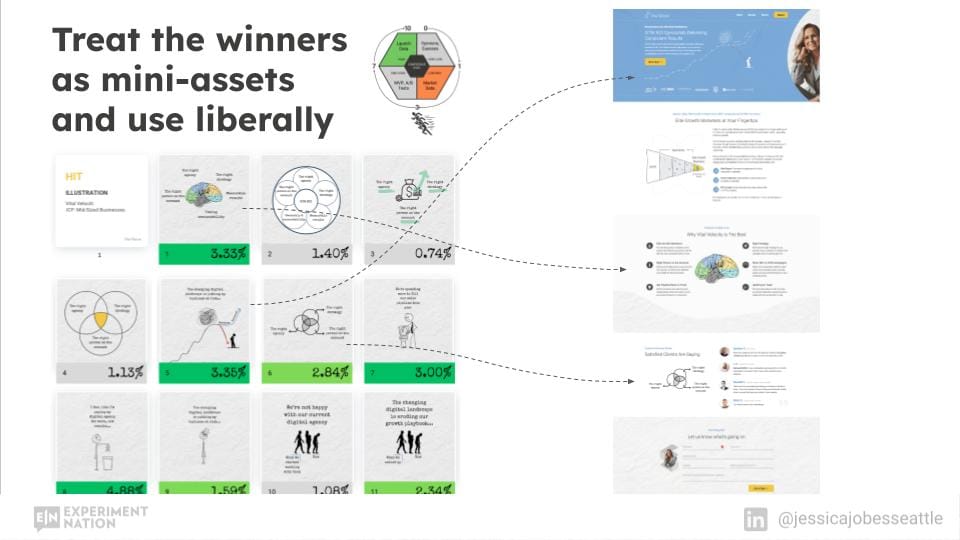
So the way I do this is for this type of a company is I treat the winners as mini assets and I use them liberally. I'm going to use them all over the place, right?
For a company that has a lot of traffic that has the ability to do CRO, we would take these winners and then we would use them in our next experiment.
This is a quote from Erach. He's got 10 years building DTC and B2B companies. He says, "The ability to employ predictive techniques to market research and validation is game changing. As a data scientist, this small data iterative modeling still blows my mind."
All right, so I hope you're learning some great stuff in here. And I'm going to take us back for a sec. I want to show us a couple more scenarios. Okay. And let's take what we've did in the beginning with how the HiPPO chose one headline. And how we're getting the click data on the Mouseflow headlines.
And I want to marry those two scenarios together. Obviously, these folks over here do not work at Mouseflow. But I just want to illustrate what's going on. So the HiPPO chose headline number 10 from Kohosh. If we overlay the Mouseflow data, that would say headline number 10 got 2.36% click through rate, which ranked number five, which is actually good.
Good job, HiPPO. You actually picked a pretty good one, "Ignite your data and insights with powerful heatmaps." Now, how did Ana do? Remember, she wasn't feeling very good after that process. Turns out hers actually won. She got the top two results. "Glow up your analytics to uncover more business growth" and "Glow up your insights to fuel a cycle of upward momentum."
And Kohash was here. That's the one the HiPPO chose. He also had one down here that was a winner. Or that didn't get any nos. So you can see when you go through this process, and all ideas are good ideas. What it does is it levels the playing field.
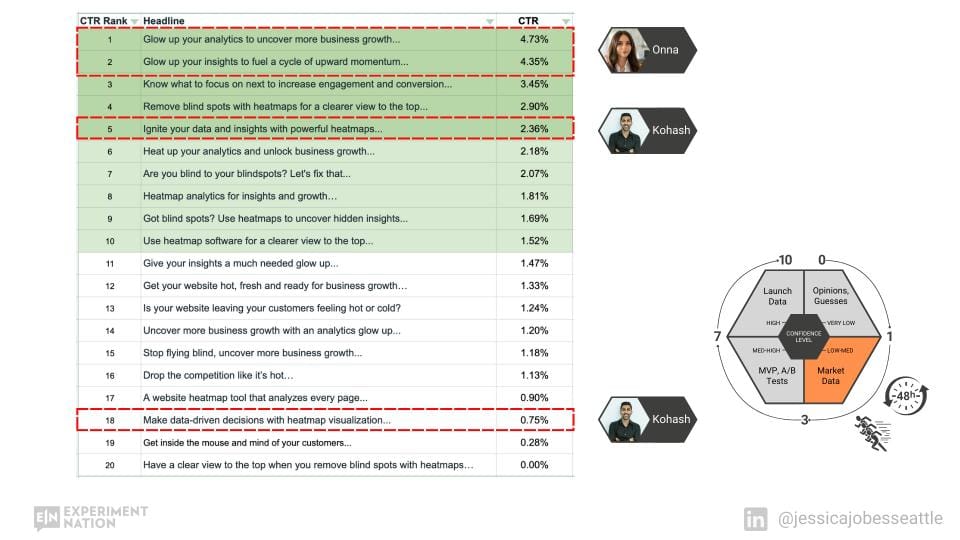
So it takes the emotion out of it. It takes the fighting out of it. And it's like, great, let's get 20 ideas. Let's get them tested. Let's get that data back like this. And then let's use that to decide what our next step is going to be.
What it also does is it helps increase innovation.
Because a lot of times people say no to ideas that are different. They might not feel like they're on brand. A lot of times my worst ideas - I still test them because I'm like, I know that one's going to win just cause I've seen it enough times. So instead of discounting something because I don't like it, I'll still test it and see what the audience thinks.
So maybe you're stuck with meh test results, you're just not able to move the needle. Run some click-tests because, and get that data to tell you which direction to go in. Because this one here, let's say the hippo would have chose number 19: "Get inside the mouse and mind of your customers." It sounds right. It sounds like a normal headline. Sounds creative, but that didn't click test very well. So that's what's happening where your team keeps coming up with ideas and you're really not moving the needle. You're not growing, you're not getting more conversions. And by adding click-testing, you can start to move that needle.
All right. So remember this headline, "Increase your testing velocity and serve the HiPPO 20 ideas with a side of data." I hope I've shown you how to do that, but also did you know I click-tested it and here's the results...
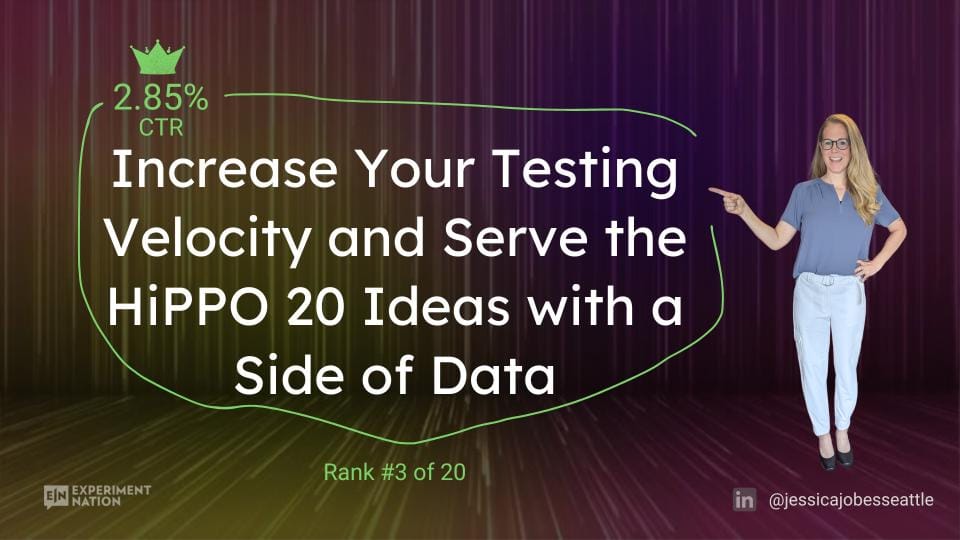
I got 2.85% click through rate and it actually ranked third. So I'm going to show you what ranked first here in just a couple of minutes. First, let me run you through a couple more scenarios for how you can apply click-testing.
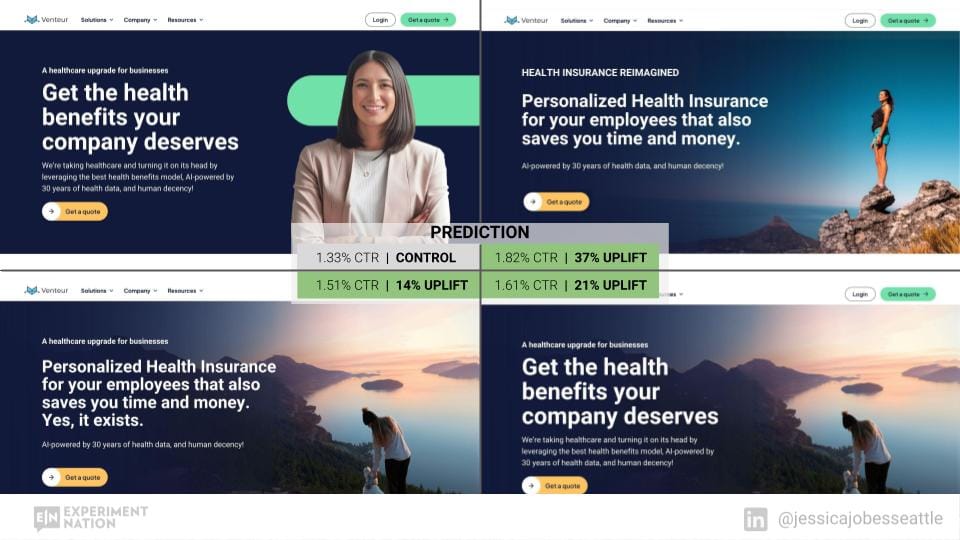
So let's say you've got your top of page. You can click test different messages and hero images. In this case, I was doing some click-testing for Venture. They were trying to decide which direction to go in with their messaging.
This one got 1.33% click through rate. That's their control. And if they would switch over to different messaging, then they can expect this type of uplift versus these results.
We've got this with a 14% uplift by switching out the image and the messaging to "Personalize health insurance for your employees that also saves you time and money. Yes, it exists." We could use the same headline, but use that different image. This is predicting a 21% uplift. And this one is a new image and new headline - "Reimagine personalized health insurance for your employees that also saves you time and money." Now notice with the imagery, what I was seeing is that the lifestyle type shot - this image actually didn't do too bad. This headline didn't do too bad, but switching out to potentially trying this in their next AB test would likely move the needle the most.
Now, I saw the opposite actually with Jo Life Foods, which is an ecom startup. And and notice how their homepage is. They've got a lifestyle shot. They've got their product image and they've got a headline. So the headline actually tested really well. So I kept that in product image did great. It was actually the lifestyle shot that didn't do as well.
So you can see this is 0.94 percent control. If we switch to this lifestyle shot, instead predicting a hundred percent uplift,
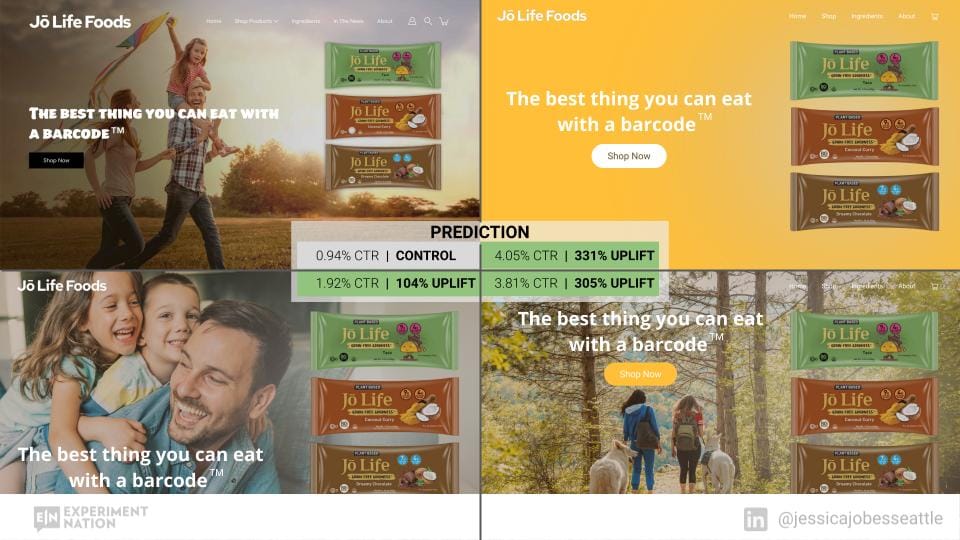
what about this lifestyle shot hiking with dogs predicting a 300 percent uplift and this one when you take out the lifestyle shot and just go with the plain background predicting an even higher uplift, almost 4 percent click through rate.
Alright, so I remember how I tested different headlines. This is the one that actually won argue about your website no more.
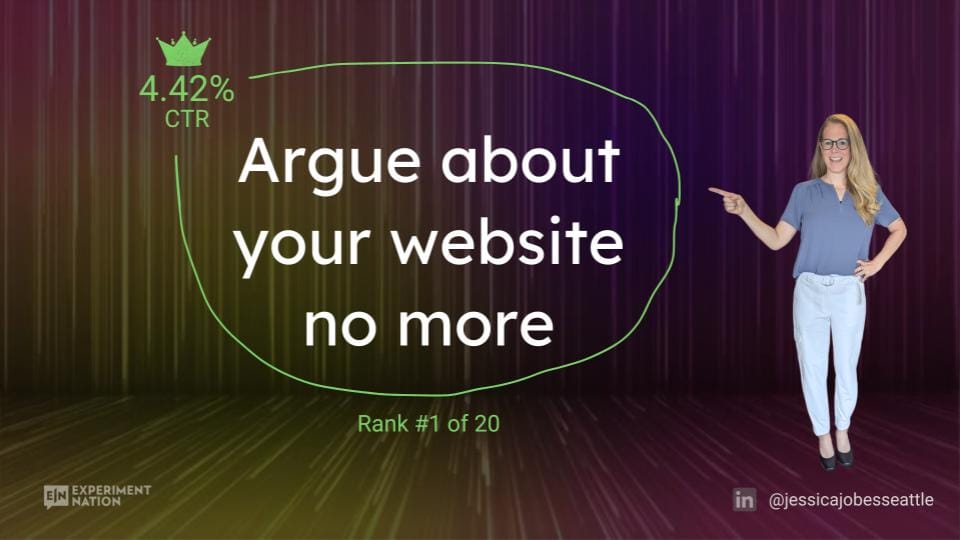
It got 4.42 percent click through rate.
I could have gone with this one, but I decided not to because click testing can be used for a lot more than just your website. Here's an example of a study that I'm doing, or just ran with Microsoft, where we're testing different messaging for a suite of products, And they're planning on using this messaging mostly internally to get all these different teams aligned.
So we did some click testing for headlines and pillars. And what we're doing here is we're doing some market data and they're going to launch it internally. So what I ended up doing on this is we started with the click testing and in order to get that next level of signal to make sure that we're headed in the right direction, we did some panel testing with winter and which I'm going to show you and then from there we selected the messaging for their internal collateral.
So this is more details on the test where we were doing quick testing on businesses, 1 million. Plus in revenue and 10 million plus in revenue. We ran through a series of eight click tests, testing the headlines and testing product pillars from there. I think I have it on the next slide. Yeah. So from there, we selected some winners and also a loser to move forward to the next level.
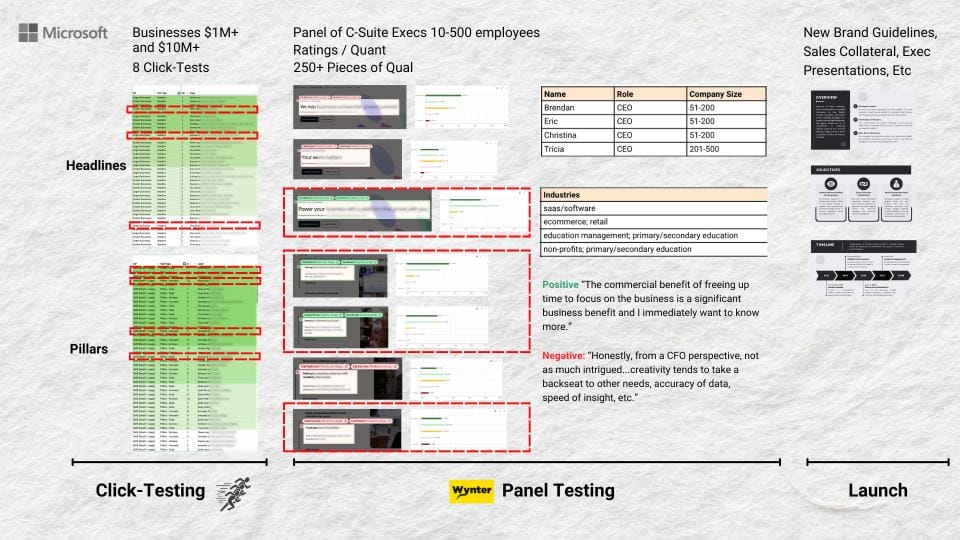
And this is quite common is even when you serve data, people are still going to decide what they're going to decide whether the data supports it or not. So in this case, this is one of the headlines that they liked and wanted to move forward to the next level.
So we moved those forward and did a survey on the different messaging and got some awesome results. We got both quantitative and qualitative. You can see here. This is a panel of C suite executives with 10 to 500 employees in winter. We're getting ratings, which is the quant data here. We're also getting a ton of qualitative pieces of feedback.
So, I can't share the results, obviously, but if you squint, you can see that this is red, this is red, this is green. So, this one tested the best. Out of all the headlines, and then for the product pillars, these are the two that tested the best.
This one also tested well, even though the overall score didn't reflect it as much.
So C, we start here with click testing where we select our audience, but we can't really see who's actually clicking or not clicking when we go to here. When you get into the panel, then you get a lot more insights about who is actually responding.
You don't get their last name. You don't know who Brendan is, but you know, Brendan's the CEO of a 50 to 200 person company and he is in the SaaS and software industry, and this is how he's responding to the different messages that we're testing. From there, the results are launched into new brand guidelines, sales, collateral, exec presentations, et cetera.
So thank you very much. I'm just going to end with a couple more case studies just so you know who's using click testing and how they're applying it and some of the results that they're getting.
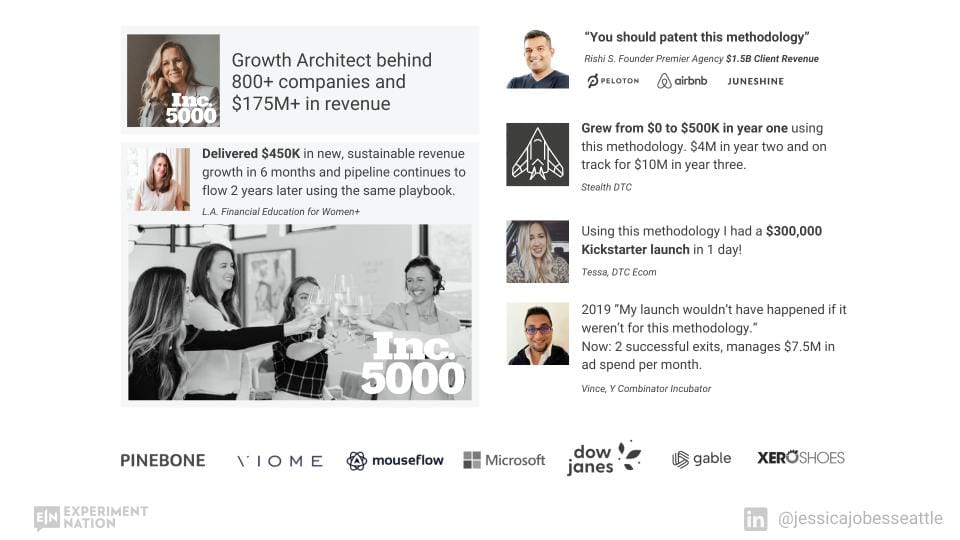
This is one of my clients that's been doing click testing for two years. They are now, I think they just ranked 80 something on the Inc 5000 list. This is Rishi. He's been doing this, I think, since 2019 with me. His agency has generated 1. 5 billion in client revenue, working with some of the largest brands.
I've got a client who's a stealth DTC company. And in her first year of using this grew from 0 to 500, 000 in the first year, and then went to 4 million in year two and is on track for 10 million this year. Which is really exciting to be on that journey with her. This is Tessa. She used this methodology and had a 300,000 Kickstarter launch in one day.
What this means is she tested all of the variables before launching. So, click test the headline, click test all your images, you can click test almost anything.
This is Vince. He click tested his whole product launch and had a successful launch and has had two successful exits, manages 7. 5 million in ad spend per month is doing a ton of click testing for his clients is using this in Y Combinator. And there I've had 800 plus clients.
There are probably thousands and thousands and thousands of click testers out there which you may not know about. I'm excited to bring this methodology to Experiment Nation so thanks for sticking with me and watching all the way through.
Enjoy the rest of the presentations.

